-
Products & Solutions TopProducts & Solutions

-
 Products & Solutions Top
-
Drives & Controls
-
UPS & Industrial Power Supply
-
Sensors & Measurements
-
Energy Management
-
Monitoring & Control System
-
Distributions & Controls
-
Transmission & Distribution
-
Transit System
-
Semiconductors
-
Energy
-
Food and Beverage Distribution
-
Service & Equipment Upgrades
-
Solutions
-
-
IR TopInvestor Relations
- GLOBAL > HMI > V8/TS2060 series > Questions about > How to draw reference lines in a trend graph or trend sampling part
How to draw reference lines in a trend graph or trend sampling part
How to draw reference lines in a trend graph or trend sampling part
- Category :
Answer
V-SFT Ver.6
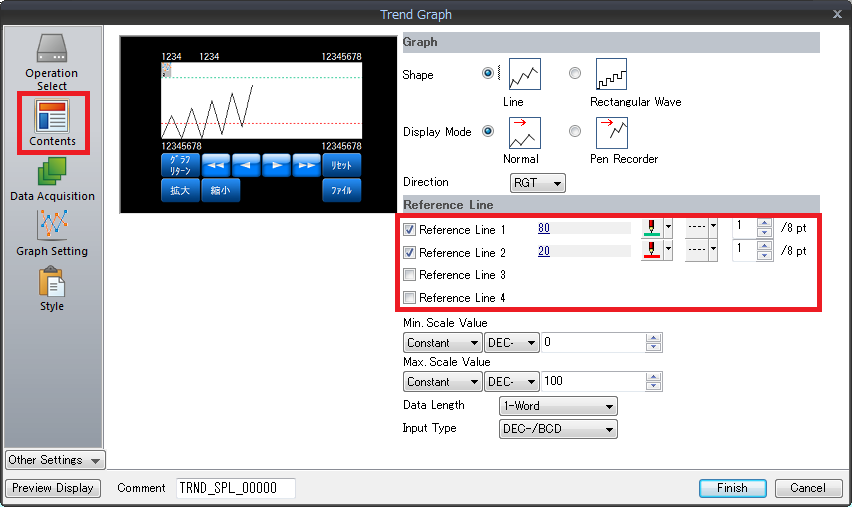
[To draw four or less horizontal reference lines]
Display the [Trend Graph] dialog and click [Contents]. Check a [Reference Line] to use and set the value for displaying and its color. (4 lines maximum)
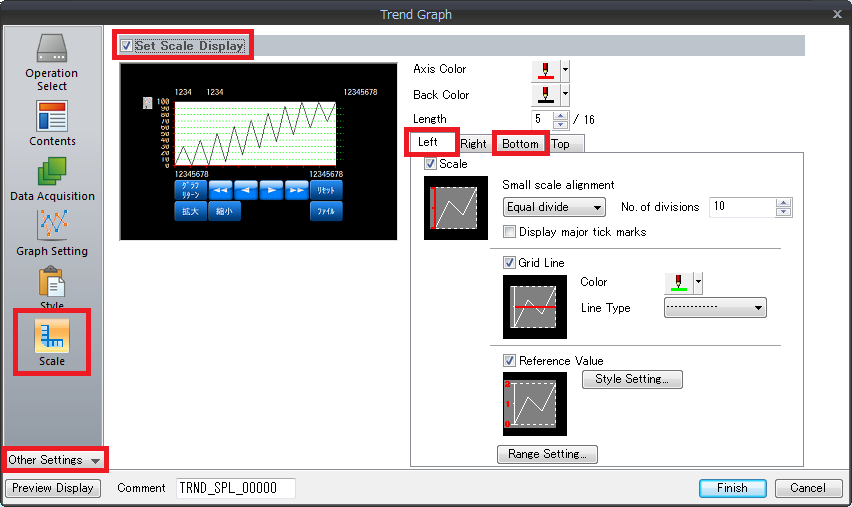
[To draw five or more horizontal reference lines or vertical reference lines]
Reference lines can be displayed on the scale marks.
For more information, click here.
Example: Configure settings on the [Left] or [Bottom] tab window.
- In the [Trend Graph] dialog, click [Other Settings] -> [Scale] and check [Set Scale Display].
- Check [Scale] on the [Left] and [Bottom] tabs. Check [Grid Line] and set as necessary.
V-SFT Ver.5
[To draw four or less horizontal reference lines]
Display the [Trend Graph] / [Trend Sampling] dialog, check [Reference Line] and set the value to be displayed and its color. (4 lines maximum)
[To draw five or more vertical reference lines]
* This is available with V-SFT version 5.4.27.0 and later.
Only with the TS/V8 series, reference lines can be displayed on the scale marks.
For more information, click here.
Example: Configure settings on the [Left] or [Bottom] tab window.
- Display the [Trend Graph] / [Trend Sampling] dialog, select [Scale], and check [Set scale display].
- Select [Left] or [Bottom] and check [Grid Line] and configure settings.
|
In the case of [Trend Graph], reference lines can also be drawn on the [Modify Part] window. In the case of [Trend Sampling], reference lines cannot be displayed correctly in this way. Be sure to draw reference lines as described above. |
